Echoes of the Past: Market Titans Then and Now
Executive Summary
Valuations and market concentration in the U.S. stock market have fluctuated dramatically over the past century, with distinct eras defined by dominant firms and shifting investor sentiment. In this piece, we take a stroll through history, recalling eras like the Nifty Fifty of the 1960s and 1970s and the late-1990s dot-com bubble. During these periods, market concentration and high valuations gave way to painful corrections, even though some companies eventually bounced back with strong long-term growth.
Fast-forward to today, and a new group of giants—the Magnificent Seven—dominate the market. These companies (Alphabet (Google), Amazon, Apple, Meta Platforms, Microsoft, Nvidia, and Tesla) now account for a significant share of the U.S. equity market, buoyed by solid fundamentals and excitement surrounding new technologies
like artificial intelligence (AI). However, their current valuations imply that they will continue to deliver robust earnings growth, a challenge that history shows is easier said than done.
The first quarter of 2025 was marked by a flurry of executive orders, tariff tensions, the Federal Reserve (Fed) grappling with an uncertain inflation outlook, and a notable shift toward international equities. Although U.S. stocks have been the envy of the world for more than a decade, growing opportunities abroad—spurred by technological advancements, attractive valuations, and positive developments, such as a potential resolution of the war in Ukraine and fiscal stimulus in Europe—are prompting a broader reassessment of investment strategies.
Blue Trust Insights
A Look at the Past: The Nifty Fifty
The Nifty Fifty era of the 1960s and 1970s serves as a textbook example of market overvaluation. This group of approximately 50 large-cap growth stocks—including household names like IBM, Coca-Cola, and McDonald’s—saw an average price-to-earnings (P/E) ratio of 56x and accounted for over 40% of the total market capitalization at their peak.1 Investors largely overlooked their extreme valuations, believing that inexorable growth would justify their prices.
Ultimately, the early-1970s bear market exposed valuation excesses, driving down many Nifty Fifty stocks by 60% or more. The group faced a slow recovery, failing to reclaim 1972 highs until 1980. During these eight years, the Nifty Fifty’s share of the overall market shrank from 40% to 23%, while the average P/E multiple fell from 56x to 17x by September 1974. Despite the short-term pain, some argue that the valuations were justified in the end. Research from economist and Wharton School professor Jeremy Siegel found that 26 years after the peak, an equally weighted portfolio of Nifty Fifty stocks had produced annual earnings growth 3% higher than the S&P 500 while nearly matching its return.2 Investors had correctly predicted that, on average, these stocks would grow faster than the market. Although some stocks ultimately produced strong long-term returns, investors first had to endure a painful adjustment period.
The Tech Bubble
The most recent example of high valuations occurred during the dot-com bubble that burst in March 2000. The late 1990s saw a surge in technology and internet-related stocks, driven by speculative fervor around the commercial potential of the new World Wide Web. At the bubble’s peak, the largest stocks in the NASDAQ Composite Index—Cisco Systems, Intel, Microsoft, Oracle, and Sun Microsystems—accounted for nearly one-third of the index’s total market value. The NASDAQ Composite later lost approximately 80% of its value during an 18-month decline, and many dot-com startups were soon forgotten.
Cisco Systems, a dot-com darling, has yet to regain its previous highs. Others, such as Amazon, went on to become massive winners. Microsoft stands out as the only stock from the dot-com era to boast a top five market capitalization both in 2000 and today. However, shareholders paid a price for excessive valuations during the dot-com era, as Microsoft’s stock saw an annual price return of -2.2% from its December 1999 peak to August 2014. Including dividends, Microsoft’s total cumulative return over a nearly 15-year period was just 0.13% (0.01% annually). Over the same period, the NASDAQ 100 Index returned 18% (1% annually), while the S&P 500 returned 75% (3.9% annually).
How the Mag 7 Compares
The Magnificent Seven (Mag 7) stocks―Alphabet (Google), Amazon, Apple, Meta Platforms, Microsoft, Nvidia, and Tesla―make up 30% of the S&P 500 and 41% of the tech-heavy NASDAQ 100 Index.3 In 2000, the most expensive of the top stocks was Cisco, with a trailing P/E ratio over 200x. Today, Tesla leads the pack with a P/E of 127x. During the dot-com bubble, the largest companies grew earnings at a compound annual growth rate of 50% in the final years of the tech bubble. Earnings of the Mag 7 have compounded on average by 42% over the last five years and are currently trading at less than half the peak multiple of the dot-com companies. Certain factors—like high and durable margins—have bolstered confidence in the Mag 7. Other factors—like strong free cash flow—have enabled substantial share buybacks, boosting earnings per share for the largest companies.
Looking Ahead
Based on current valuations, the market expects each of the Mag 7 companies to continue producing double-digit earnings growth. This result is possible as companies from both the Nifty Fifty and dot-com bubble were able to sustain strong earnings growth and become long-term winners; however, the outcome for the Mag 7 remains uncertain.
Although these companies have benefited from the excitement surrounding the AI buildout, we know that investors will eventually demand tangible results from the significant capital investment these companies have made. Any disappointment in earnings growth or the broader AI theme will likely trigger a sell-off in the stocks that have benefited the most. As we saw after the dot-com bubble, the internet did go on to change the world, and some of the most richly valued companies went on to provide tremendous returns. However, even the greatest winners endured significant pain, like Amazon’s 90% decline and Microsoft’s near-zero return over 15 years. While we are not calling for a similar drop in the Mag 7, it would not be surprising if valuation-induced headwinds resulted in a period of relative underperformance for today’s seemingly invincible market leaders.
Today’s tech giants are entrenched in our everyday lives in ways that previous tech leaders were not, and their margins, free cash flow, and global scale may suggest a more sustainable trajectory. Although current valuations for mega-cap leaders appear more grounded in fundamentals compared to past bubbles, we would caution against a “this time is different” mentality, as historical patterns suggest that concentration and high valuations often precede periods of market broadening or correction. Drawing on data from previous periods of market concentration, research from Goldman Sachs suggests that concentration levels could have a meaningful effect on long-term stock market performance.4 This outcome can be attributed to the increased volatility of concentrated portfolios, along with the fact that the high valuations of the stocks driving the concentration may not adequately compensate investors for the added risk. The research forecasts a 10-year average annual return of 3% for the S&P 500, well below the historical average of 11%.
The Current Environment
For the past several years, U.S. equity outperformance has been driven by a resilient economy buoyed by deficit spending, strong corporate earnings, technology and innovation, and an increased labor force from immigration. The potential for reduced government spending, new technological competitors, and a decrease in immigration—combined with high valuations—could cause the coming years to unfold differently. A serious commitment to fiscal restraint may impact economic growth, while the emergence of new AI competitors abroad could put a damper on AI enthusiasm in the U.S. as investors adjust to new competitive realities. New immigration policies could lead to upward pressure on prices in some sectors of the economy while easing prices in others. If the aforementioned tailwinds begin to fade, investment opportunities outside of the U.S. may broaden, leading to a more diversified investment landscape.
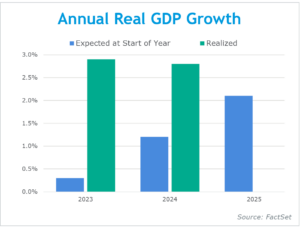
We believe market expectations are one of the most significant risks facing the markets in 2025. Entering the year, expectations for economic growth were much higher than for the previous two years, creating a lower threshold for disappointment.
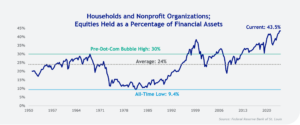
Investors also seem to have an optimistic view of the future, as surveys have shown that they are anticipating above-average market gains to continue.5 Given stocks’ remarkable 16% annualized gains since bottoming in 2009, returns seem unlikely to remain this high. It is worth noting that when we compare the return of stocks over cash, from 2010 to 2024, U.S. equities produced their best 15-year performance dating back to 1970. U.S. stocks outperformed cash by 12.2% annually, more than double the average of 5.9%. U.S. household stock allocations and foreign ownership of U.S. stocks are also sitting near all-time highs, suggesting that current positioning and expectations are pricing in a continuation of U.S. exceptionalism. Any threat to the growth narrative—such as a disruptive reordering of global trade or AI disappointment—may knock markets off course and lead investors to pursue opportunities outside the U.S., where stocks are less expensive.
From the time Chinese AI company DeepSeek made headlines in January through the end of the first quarter, the Chinese Hang Seng Tech Index is up 20%, while the NASDAQ 100 Index is down 12%. We also saw renewed optimism in Europe, where stocks have increased 11% amid hopes for a conclusion to the war in Ukraine and an injection of fiscal stimulus in Germany. Although one quarter of outperformance is too little evidence to declare an international stock renaissance is upon us, we believe the combination of factors listed above may portend a period of relative underperformance for U.S. markets and a potential peaking of U.S. market concentration. However, a peak in market concentration doesn’t necessarily spell doom. Over time, other innovative firms may chip away at the market capitalization dominance of leading companies by steadily gaining market share.
We do not dispute the narrative of U.S. exceptionalism. It is supported by structural factors, like rule of law, and company-specific attributes, such as higher earnings growth. These factors have meaningfully contributed to U.S. outperformance since 2009. However, we must also acknowledge when valuations warrant caution. As Warren Buffett has said, “Price is what you pay; value is what you get.”
Economic and Market Recap
Investors have experienced a roller coaster of market performance to start the year. An early wake-up call came in January as Chinese AI firm DeepSeek showcased capabilities that startled investors, leading many to question whether U.S. tech firms will remain dominant in the years ahead. In February, markets were influenced by the possibility of increased tariffs, and the ambiguity surrounding their implementation added to the turmoil. In March, tariff volatility continued as Canada and the European Union responded with tariffs on U.S. goods. Click here to read commentary about recent tariff events in April.
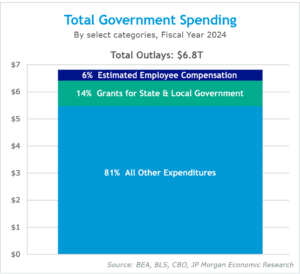
Throughout the quarter, the newly created Department of Government Efficiency (DOGE) continued to make daily headlines. Although expectations are high for many, DOGE’s impact on spending is likely to be negligible. Initially, DOGE focused on reducing the number of federal employees and the U.S. Agency for International Development, which only make up a small part of overall government spending. DOGE is tasked with helping the Trump administration reduce the deficit to 3% of GDP (gross domestic product). However, achieving this goal while simultaneously extending the Tax Cuts and Jobs Act may be extremely difficult without significant spending cuts. As we highlighted in our last Economic Review & Outlook, the administration should expect pushback to government spending cuts. We have already seen some members of Congress balk at reductions to funds allocated for their constituents.
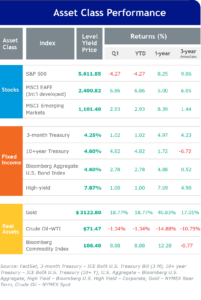
In the first quarter, we saw a meaningful shift toward international equities, with both developed and emerging market stocks outperforming the U.S. year-to-date. Optimism over a potential end to the Ukraine war and expected fiscal stimulus in Germany has lifted sentiment, driving strong equity outperformance in Europe relative to the U.S. Meanwhile, commodities and gold saw impressive gains with minimal volatility. Bonds have provided a welcome hedge to recent U.S. equity volatility, up 2.8% for the quarter while the S&P 500 was down 4.3%.
Regarding the equity market sell-off, we see two primary forces driving the decline. First, U.S. tariff policy injected uncertainty into global trade. Markets reacted swiftly as investors assessed the impact on supply chains, consumer prices, and economic growth. Markets fear that policy uncertainty may cause businesses to sit on their hands and lead consumers to pull back on spending, potentially resulting in a growth slowdown.
The second factor behind the sell-off is the uncertainty surrounding the Fed’s monetary policy amid persistent inflation. At the January and March meetings, the Federal Open Market Committee decided to maintain the federal funds target range of 4.25% to 4.5%, citing elevated inflation pressures. This cautious approach has raised concerns that the ongoing trade tensions could hinder progress in controlling inflation, thereby limiting the Fed’s flexibility in adjusting monetary policy.
U.S. stocks have enjoyed a strong run over the past two years, and with markets coming into the year priced for perfection, U.S. equities were vulnerable to disappointment. Thus, in a world rife with uncertainty, it’s not surprising that markets experienced some volatility in the first quarter.
Within our portfolios, we have maintained a preference for international stocks, which have benefited investors amid a strong first quarter for international equities. While economic indicators in the U.S. have softened, they do not suggest that a recession is imminent. The unknowns that we will be watching include DOGE’s impact on employment and spending, the effect of tariffs on economic growth and inflation—and consequently, the Fed’s policy stance—and the influence of stricter immigration policies on the labor market.