
Portfolio Impact of Fed Rate Cuts
On September 18, the Federal Reserve (the Fed) lowered the federal funds rate by 0.50% (50 bps). Whether the Fed would cut rates by 0.25% or 0.50% was hotly debated, and opinions oscillated based on inflation and unemployment data. There were valid arguments for both. Regardless, this cut indicates the Fed is entering a rate-cutting season, so a logical next question is, “How will my portfolio be impacted?”
Cutting interest rates, in theory, is stimulative for the economy and markets. This is because when the Fed lowers interest rates, it lowers the borrowing rate for corporations and individuals, which fuels spending, investing, and expansion. However, it is important to remember that the market will start pricing in rate cuts (or hikes) before the actual Federal Open Market Committee (FOMC) meeting, and subsequent portfolio performance is influenced by countless other factors besides the Fed’s interest rate policy.
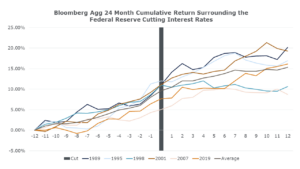
With that said, let’s look at the six most recent periods1 when the Fed has cut interest rates and see how it impacted the financial markets. Below are charts of the S&P 500’s and Bloomberg U.S. Aggregate’s 24-Month cumulative return surrounding the Fed’s decision to cut interest rates.2
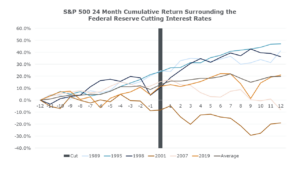
Orange shaded lines indicate a recession took place during the rate-cutting season. Blue lines indicate a recession did not take place.
Observations
- The stock market has typically risen, entering and following a rate cut.
- Recessions followed the last three rate cuts in 2001 (Dot-com bubble), 2007 (GFC), and 2019 (COVID in 2020) which has significantly impacted the S&P’s returns following the rate cut.
Observations
- Bonds have also typically risen before and after a rate cut. Bonds have an inverse relationship with interest rates, so we would expect to see this.
- Bonds provided strong diversification during the previous three recessions.
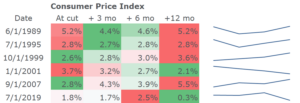
Let’s now examine some different indexes and look at performance before and after rate cuts.
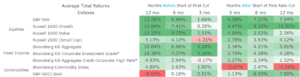
*The averages of the Bloomberg US Corporate Investment Grade and Corporate – High Yield do not include data from 1989 as that data was not available.
Observations
- Fixed income performed best before the actual rate cut, which reinforces why trying to time rate cuts is a mistake. Again, the markets are pricing in what the Fed will do before any cuts are actually made.
- Related to the point above, most assets performed better in the 12 months before the rate cut but continued to see positive performance post rate cuts.
- Growth stocks performed well as they also tend to be inversely related to interest rates and benefit from expansionary monetary policy.
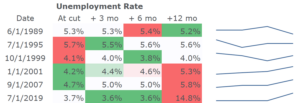
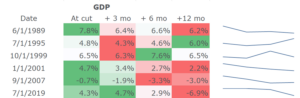
We know it’s tempting to make investment decisions based on these figures. However, while there could be some benefit to making some tactical changes, the future performance of your portfolio will be very different depending on subsequent market and economic conditions. Returning to the data3 from previous interest rate cuts, we see a trend that unemployment and GDP typically improve when a recession hasn’t occurred, and inflation may initially dip but bounce back with mixed results. However, future economic conditions and whether a recession will take place after a rate cut is impossible to know ex-ante. Currently, there are some outlier events related to the wars in Russia/Ukraine and Israel/Hamas, concerns over an artificial intelligence bubble, and uncertainty regarding the U.S. election, but we don’t see a high probability for a hard recession.
Still, we have a more cautious outlook. Inflation has moderated, unemployment hasn’t spiked significantly, and growth (both domestic economic and corporate earnings) has remained strong, which is promising for achieving a soft landing. However, there could be lagged effects from the past two years of higher interest rates. Some corporations were able to lock in lower interest rates before the Fed started raising rates, and others have been able to extend terms or hedge the higher borrowing costs, as evidenced by $1.4 trillion of outstanding debt by 2026 decreasing to $400 billion by 2028, according to Pitchbook/Morningstar LSTA US Leverage Loan Index. Larger corporations may have been able to refinance more of their debt, but smaller corporations are feeling the pressure of higher interest rates, as evidenced by a decrease in debt service coverage levels.
Consumers are also feeling the pinch of higher costs from inflation. Household net worth has bolstered consumer spending, thanks to the recovery in the markets post COVID, but credit card debt is running higher, and savings are running lower, particularly in the low- and middle-class households. The Fed cutting rates could alleviate this pressure, but a key concern is whether this will reignite inflation. The market’s 5-year inflation projection as of 9/19/2024 is 1.98%, which is understated in our opinion. Furthermore, the Fed’s cut and following communication indicated they were concerned enough about the labor market to lower rates by 50 bps vs. 25 bps, which leads to some concern that the Fed started cutting rates too late and unemployment could spike.
If the Fed achieves a soft landing, meaning inflation continues to moderate closer to 2% and unemployment doesn’t significantly increase, the economy would be in a good position to experience strong growth. However, if inflation were to spike, resulting in the need to increase interest rates again, this could have significant impacts on the U.S. economy’s growth prospects, not to mention fiscal implications for the U.S. government, hence why we remain cautious after this rate cut but are still looking for attractive entry points into assets that are trading towards their lower end of historical valuations.
For more insights and real-time reflections, follow Brian McClard, Chief Investment Officer, on X (formerly Twitter).
1 There is some subjectiveness in determining an “interest rate cutting season”. In general, a cutting season comes after the Fed first increases rates and then keeps them unchanged for a period. There are other periods outside of the data used that could be considered, but index data may be limited.
2 Returns source: FactSet. Index performance reflects reinvestment of dividends but does not reflect any fees, expenses or sales charges. An investment cannot be made directly in an index. Past performance does not indicate future results.
3 Source is Federal Reserve Economic Data (FRED). Due to the availability of data from FRED, dates were chosen that most closely align with the day the Fed cut interest rates.
CAS00000663-09-24