Is U.S. Housing in Another Bubble?
The primary cause of The Great Recession in 2008-2009 was the collapse in the U.S. housing market. Fourteen years later, this industry is the focal point again as housing has become unaffordable for many Americans. Before the last housing bubble burst, price appreciation peaked at 14.5% (on an annual basis). This time, prices increased more rapidly peaking at 20.8% in March of 2022.[1] In addition, mortgage rates have surged from 3.11% to 7.08% this year, the highest since 2002.[2]
Together, rapidly increasing housing prices and surging mortgage rates have made homes the least affordable in over 30 years.[3] For example, people buying a median new home in September 2022 would have needed $25,000 more for a 20% down payment than those buying a comparable house two years ago, and they would have a $1,300 higher monthly payment.[4] These numbers illustrate why there is concern that we might experience a repeat of 2008. In this article, we examine the state of the housing market and its implications for the broader economy.
Differences Between Now and the 2008 Housing Bubble
First, unlike before, the market is not currently oversupplied. While the number of new houses for sale has surged to a level only exceeded by the leadup to the last housing bubble, the composition of housing inventory is very different from before. Now there is a higher proportion of houses on the market that builders have not started or are still under construction—leaving the number of completed houses for sale quite low. Nevertheless, new home inventory has begun to rise and will likely continue to increase as labor and supply shortages ease and sales volume slows. However, we don’t expect a large wave of supply to inundate the market as shortages still persist, and homebuilders are opting to delay construction on homes still in the early stages of construction.
Second, lending quality is better now. Currently, the median borrower’s credit score is more than 50 points higher than in the first quarter of 2007, and today’s least qualified borrowers have scores close to 90 points higher than before.[5] In addition, the types of mortgages issued today are much safer. In the leadup to the previous crisis, adjustable-rate mortgages (ARMs)—which offered fewer protections than they do now—were very popular, documentation requirements were lighter, and risk disclosures were weaker.
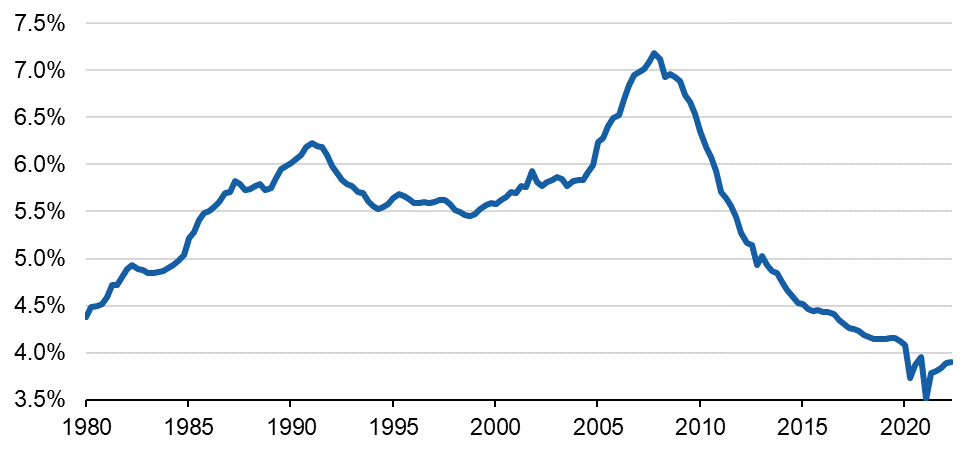
Third, most households are in a stronger financial position. Despite higher mortgage balances, mortgage payments as a percent of income are near all-time lows. If the job market doesn’t deteriorate significantly, then homeowners should have enough income to make their mortgage payments.
Mortgage Payments as a Percentage of After-Tax Income
Source: FRED
Fourth, the financial sector is less risky now relative to pre-2008. In response to The Great Recession, Congress passed major reforms (e.g., the Dodd-Frank Act) to reduce risk in the financial system. Banks are also much better capitalized, and issuance of securities backed by non-agency residential mortgages (which were largely responsible for turning the housing crisis into a broader financial crisis) remain at a fraction of their pre-2008 levels.
Housing Market Outlook and Economic Implications
Given that home prices increased 40% from June 2020 – June 2022 and mortgage rates are the highest we’ve seen since 2002, there’s certainly downside-risk to housing prices. In fact, national home prices (on a seasonally adjusted basis) appear to have peaked in June. In July, prices declined 0.5%, followed by a 0.9% decline in August (the most recent data available). These are the first monthly declines since home prices bottomed in 2012.
Most economists expect a further decline in home prices, but not as significant as we saw in the last housing crisis when home prices nationally declined -26% over five years. Today’s healthier balance between supply and demand, more conservative lending practices, and households’ stronger financial position should help limit the downside.
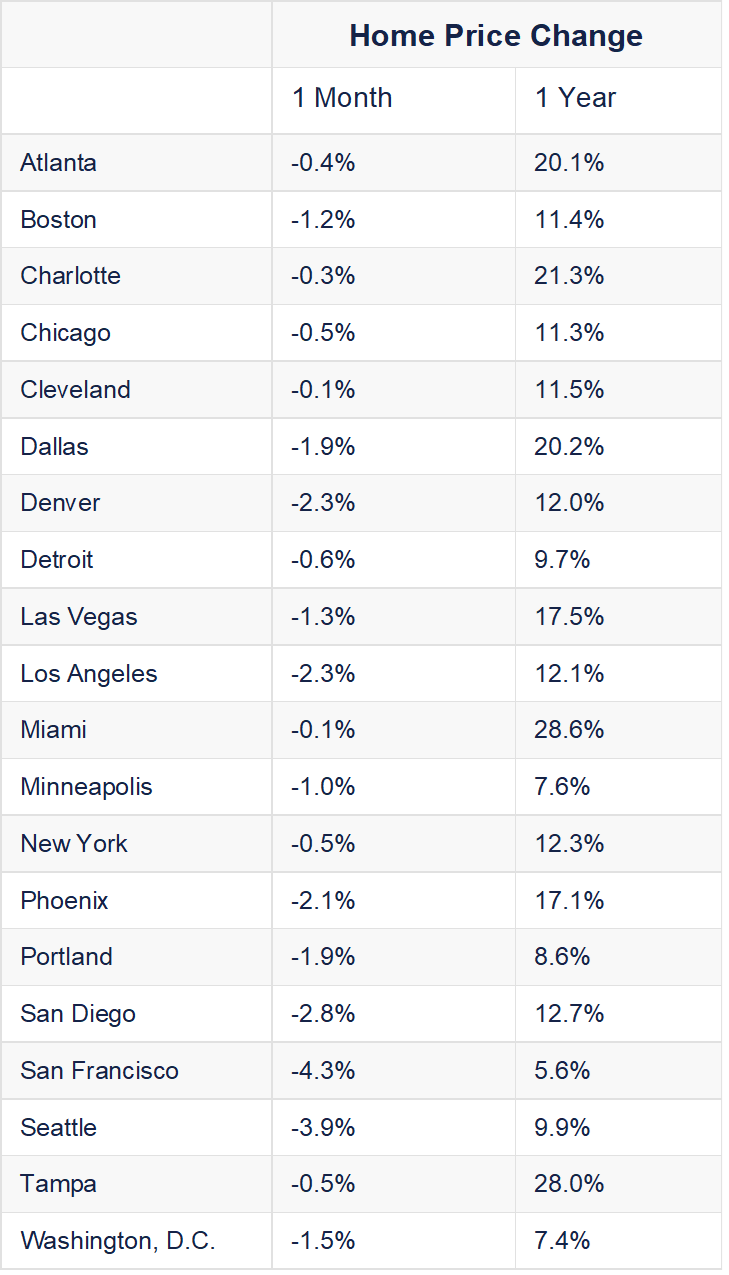
While many economists are predicting total housing price declines of 5-10% at the national level, real estate is heavily influenced by local dynamics, so each city’s experience will differ. It’s notable, however, that in August all 20 major metropolitan areas in the country declined, though to varying degrees (see the table at the end of the article for specific declines). Whether economists’ forecasts come to fruition will largely depend on the path of the broader economy. One of the main factors squeezing housing affordability is high mortgage rates, which have surged due to the Federal Reserve’s (Fed’s) rapid tightening of monetary policy. If the Fed is successful at lowering inflation without causing a spike in unemployment, mortgage rates could ease, which would help limit declines in home prices.
However, at least a modest correction is likely unavoidable. Home prices are stretched, inflation-adjusted wages are declining, savings have decreased, and housing is one of the primary ways that monetary policy affects the economy, due to its high sensitivity to interest rates. A housing slump, characterized by a reduction in construction, prices, and sales volume, is exactly what the Fed aims to achieve in order to cool aggregate income and spending growth. The silver lining is that, for the reasons mentioned previously, we don’t believe a housing slump will spark a broader financial crisis this time. In the quarters ahead, it’s likely that the economy will continue to slow—even contract—as inflation and higher interest rates weigh on consumer spending and business investment, but a financial crisis (especially one caused by falling house prices) seems unlikely.
At Blue Trust, we strive to meet clients where they are and walk their financial journeys with them. We want to help you create a plan to meet your financial goals. For more information on making wise housing decisions in this market, click here. If you need assistance and would like to talk to a Blue Trust advisor, please contact us at 800.987.2987 or email blog@bluetrust.com.

Source: S&P Global. As of August 2022.
[1] Source: S&P/Case-Shiller Home Price Index
[2] Source: Freddie Mac, as of 10/27/22
[3] Source: NAR Housing Affordability Index, as of August 2022
[4] Source: U.S. Census Bureau, Freddie Mac, and Blue Trust
[5] Source: New York Fed, as of Q2 2022

